


Introduction
Architectural visualization pricing is one of the least transparent conversations in the development and architectural services landscape — and the opacity costs developers, architects, and studios money on both sides of the transaction. Developers who do not understand what drives visualization cost consistently either overspend on formats that do not deliver the commercial outcomes their projects require, or underspend on critical presale assets in ways that slow campaigns, reduce buyer conviction, and cost more in extended carrying costs than the visualization budget saving was worth. Understanding what actually determines architectural visualization pricing is the first step toward making investment decisions that generate measurable return.
The range of architectural visualization pricing quoted for seemingly similar deliverables across Vancouver’s development market is wider than most clients anticipate when they begin the procurement process — and the variation is not primarily explained by studio size, reputation, or margin difference. It is explained by fundamental differences — and architectural visualization pricing reflects each of them — in production methodology, technical infrastructure, creative capability, and the commercial purpose each studio designs its work to serve. A quote for static renders and a quote for a real-time interactive environment serve different commercial objectives even when both are described simply as architectural visualization. Comparing them by price per image misses the most important dimension of the decision entirely.
This article provides a clear framework for understanding architectural visualization pricing — a guide to architectural visualization pricing that serves every budget level — what drives it, why it varies, where hidden costs originate, and how to evaluate quotes against commercial outcomes rather than comparing line items that are not comparable. HUUR Studios applies this framework to every client conversation about architectural visualization pricing — because a client who understands what they are purchasing makes better investment decisions and achieves stronger returns from their visualization budget across every project they bring to market in Vancouver and throughout North America.
What Determines the Cost of Architectural Visualization?
Architectural visualization pricing is determined by a combination of project-specific variables that interact in ways that are not always immediately obvious to clients evaluating quotes. The most significant cost drivers are scope complexity, production format, technical infrastructure requirements, level of creative direction, and revision cycle structure — and each of these variables can move the total investment by a factor of 2 to 5 times relative to a baseline project of apparently similar description. Understanding each driver independently is the foundation for evaluating any visualization quote accurately.
Scope complexity is the most intuitive architectural visualization pricing driver: a single-room residential interior requires less production investment than a full building exterior with context modelling, and a development with 15 unit types requires more than one with 3. But scope complexity within a single deliverable also varies significantly in ways that affect architectural visualization cost substantially — the complexity of the architectural geometry, the density of exterior context and landscaping, the specificity of material and lighting requirements, and the number of camera positions or navigable areas all multiply the production hours required to deliver the finished asset.
3D Rendering Pricing Factors: Production Depth
The 3D rendering pricing factors that most directly determine cost beyond scope are production depth — the level of detail, accuracy, and creative refinement applied to every element of the scene. A photorealistic hero render produced for a luxury presale campaign involves extensive custom material creation, highly detailed foreground modelling, considered human figure placement and styling, multiple lighting setup iterations, and extensive post-production — investments of production time per image that a standard documentation render simply does not require. The price difference between a documentation render and a campaign-quality hero image from the same studio reflects this production depth difference directly.
HUUR Studios is transparent about this production depth variable in every architectural visualization pricing conversation — because architectural visualization pricing transparency — explaining the specific production investments that distinguish a deliverable designed to perform commercially from one designed simply to document a design accurately. For Vancouver developers, understanding this distinction is essential for evaluating quotes that appear to cover the same deliverable category but differ significantly in production approach and intended commercial purpose.
Platform and Infrastructure: The Hidden Cost Variable
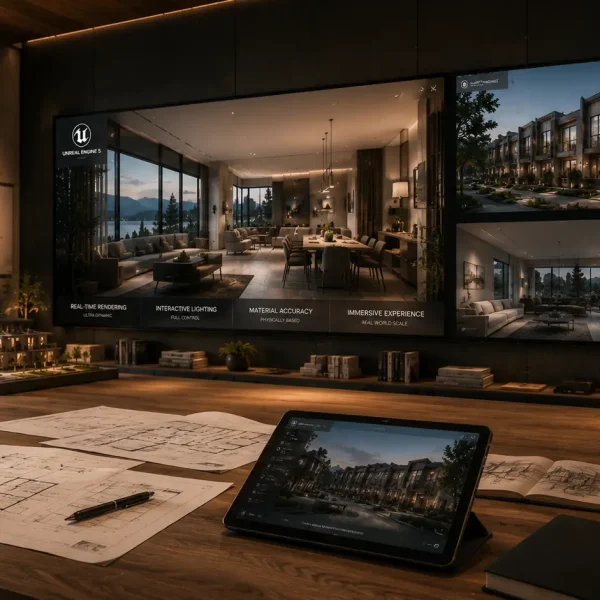
One of the most significant and least visible architectural visualization pricing variables — one where architectural visualization pricing diverges most dramatically between studios is the technical infrastructure investment required to deliver specific production formats. Static CGI renders require a render farm and skilled 3D artists — infrastructure that is relatively standard across the professional visualization market. Real-time interactive environments built on Unreal Engine require real-time platform engineering, interactive feature development, and cross-platform deployment capability that represents a substantially higher infrastructure investment — and this investment is reflected in the pricing of real-time deliverables relative to equivalent static ones.
Studios that have made this infrastructure investment price their architectural visualization pricing accordingly that reflects both the cost of the infrastructure and the superior commercial performance of the format relative to static alternatives. Studios that have not made this investment cannot offer genuine real-time capability at any price — which means that when architectural visualization pricing for a real-time deliverable appears very low relative to market rates, the most likely explanation is that the deliverable is not genuinely real-time or does not include the interactive capability that real-time delivery is expected to provide.
START YOUR PROJECT WITH HUUR
Contact our team or explain and submit your project .
Revision Cycles and Change Management
Revision cycle structure is one of the most common hidden costs — and it is where architectural visualization pricing structures vary most dramatically significantly between studios. Some studios quote a base price that excludes all revisions beyond the first round, with additional rounds billed at rates that can rapidly multiply the initial investment on projects where design evolution or client feedback generates more revision cycles than the base quote anticipated. HUUR Studios structures every engagement with revision cycles explicitly defined upfront — ensuring that clients understand the full investment scope before production begins rather than discovering it in mid-project additional service invoices.
Why Pricing Varies Between Visualization Studios
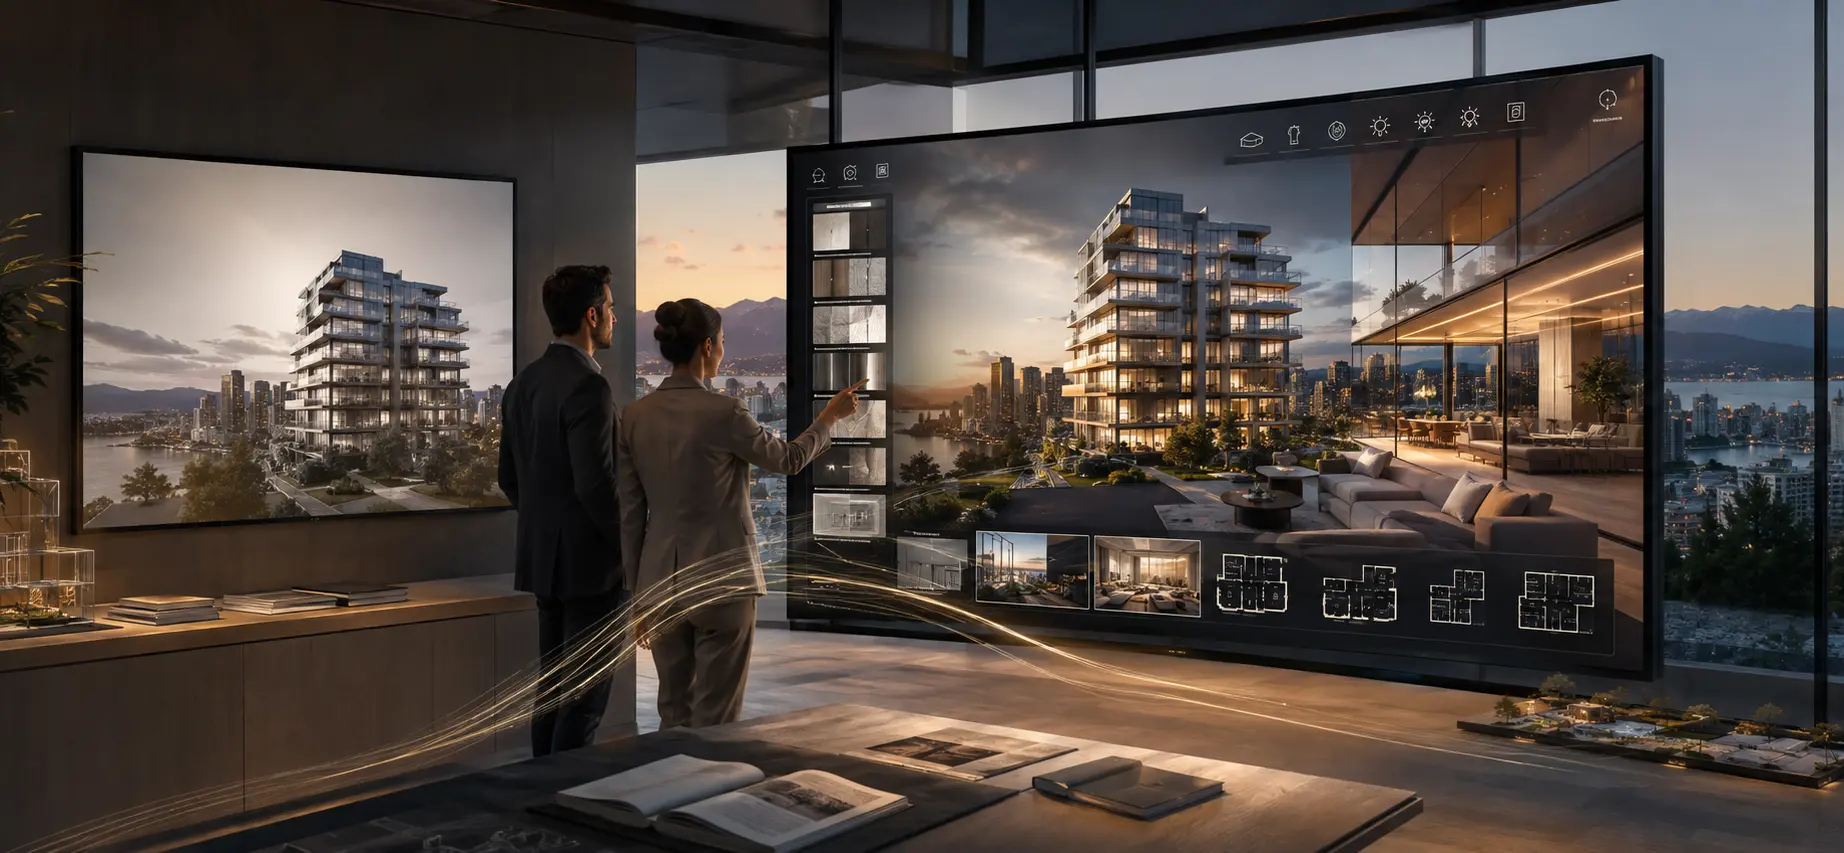
Architectural visualization pricing varies between studios — and understanding architectural visualization pricing variation requires looking beyond the obvious factors of studio size, reputation, and geographic location. The most commercially significant pricing differences between studios reflect genuine differences in the commercial purpose each studio’s work is designed to serve, the technical infrastructure available to deliver specific formats, and the creative and production standards applied across every stage of the engagement. Understanding these differences is essential for evaluating quotes that appear to cover the same deliverable category but differ substantially in price.
Visualization service pricing — and the architectural visualization pricing differences it generates — also reflects the difference between studios whose primary market is design documentation — serving the internal communication needs of architecture practices at cost-sensitive price points — and studios whose primary market is presale and marketing visualization — serving the commercial performance requirements of developers at price points that reflect the revenue impact the work is designed to generate. These are different products, and comparing their architectural visualization pricing directly is as misleading as comparing the price of a printed brochure to the price of a television advertisement.
Pricing Models for Visualization Services
Pricing models for visualization services — and with them, architectural visualization pricing structures — vary significantly between studios in ways that affect both the total investment and the budget predictability that clients need for project financial planning. The most common structures are per-image pricing for static renders, project-based pricing for defined scope packages, time-and-materials pricing for iterative design development programs, and retainer-based pricing for ongoing studio relationships. Each model has commercial advantages and risks for the client — and the right choice depends on the project’s design stability, revision requirements, and timeline.
3D rendering pricing factors — a key driver of architectural visualization pricing variation — also differ between studios on design change management — whether design revisions between quote and delivery are absorbed within the original scope or billed as additional services. For presale visualization on Vancouver developments where design may continue evolving through the presale period, this change management structure can be a more important financial variable than the base quote price on which initial comparisons are typically based.
Geographic and Market Factors
Architectural visualization pricing across North America’s most active development markets — Vancouver, Toronto, New York, Los Angeles, and Miami — reflects both the cost structure of operating in those markets and the commercial expectations of the developers and architects who constitute their primary client base. Vancouver’s luxury presale market specifically demands visualization quality and interactive capability that would be exceptional in smaller markets but is baseline expected by Vancouver developers whose buyers regularly compare their presale experience against the highest-quality digital marketing presentations they encounter across every other sector of their lives.
The Difference Between Cheap Renders and High-Value Visualization
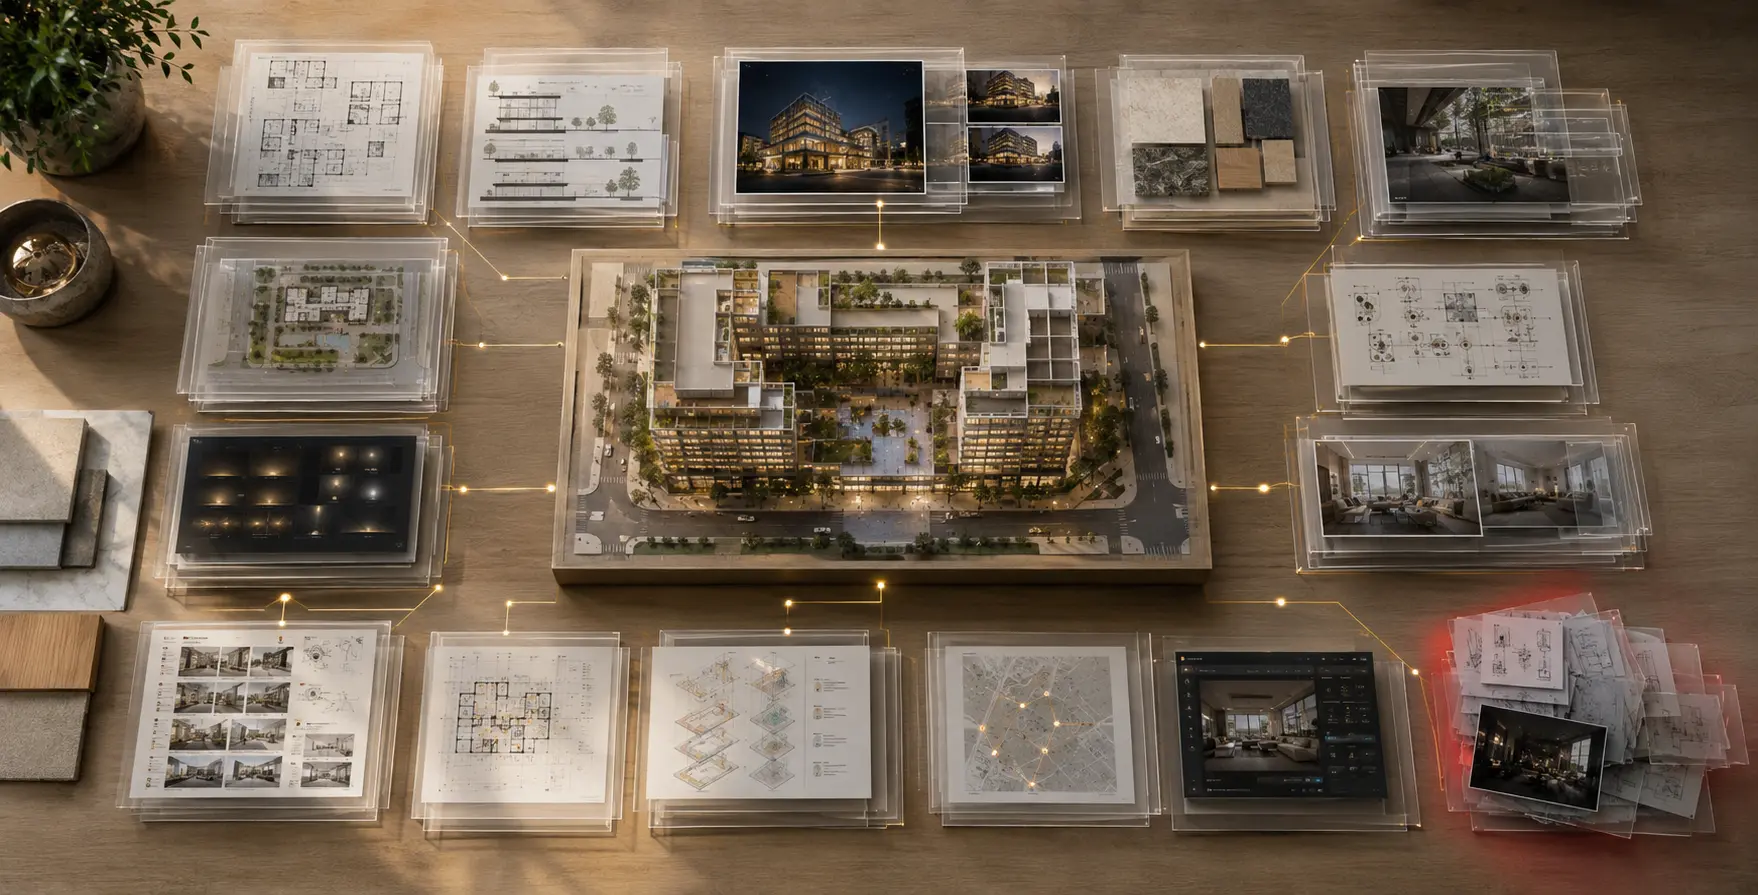
The most consequential architectural visualization pricing decision most Vancouver developers face — the one where architectural visualization pricing has its highest commercial impact is not between different studios at similar quality levels — it is between investing in visualization designed to perform commercially and investing in visualization designed simply to document a design at the lowest possible production cost. Both categories of work exist in the market, serve legitimate purposes in appropriate contexts, and are described using the same terminology. The commercial consequences of confusing them are significant and frequently realized only after the presale campaign is underway and the buyer engagement numbers tell the story the visualization budget decision made inevitable.
The value of architectural visualization is not expressed in the image itself — it is expressed in the commercial outcomes the image generates. A beautifully produced hero render that gives a buyer a compelling visual impression but leaves their key spatial questions unanswered generates a different commercial outcome than a photorealistic interactive environment that resolves those same questions through direct exploration. The price of the interactive environment is higher. The return on that investment — measured in buyer conversion rate, sales velocity, and carrying cost avoided — consistently exceeds the price premium when the development is measured over the full presale campaign rather than at the moment the invoice is approved.
What Cheap Visualization Actually Costs
Low-cost visualization’s actual architectural visualization pricing cost — the real architectural visualization pricing consequence — is most visible in the outcomes it fails to produce rather than in the invoice it generates. Buyers who cannot resolve their evaluation questions from the available visualization extend their decision timelines — adding weeks to the average days-from-first-contact-to-offer metric that determines how quickly carrying costs are recovered through presale subscriptions. Buyers who approve from inadequate spatial understanding generate post-sale disputes and satisfaction issues that cost developer reputation and remediation budget that dwarfs the visualization cost saving that enabled the inadequate presentation in the first place.
HUUR Studios is explicit with Vancouver development clients about this cost arithmetic — because the decision to invest in higher-quality visualization is most confidently made when the full cost of the lower-quality alternative is understood. A visualization package that costs 40% less than a premium alternative but generates a presale campaign 6 weeks longer than it would have been with stronger buyer-conviction tools has not saved money — it has reallocated the cost from the visualization budget to the financing cost budget, where it appears in a different column but represents real financial impact.
How to Identify High-Value Visualization
The markers of high-value architectural visualization pricing — the signals that distinguish architectural visualization pricing designed for return are not exclusively found in price — they are found in the alignment between the proposed deliverable and the commercial outcome the client needs to generate. A studio that begins the conversation by asking what the visualization needs to accomplish commercially — not what format the client wants to order — is more likely to propose a package designed to achieve the required outcome than one that simply fills a client’s brief with a standard menu of deliverable formats at competitive per-unit prices.
The specific questions that reveal alignment between proposed visualization and commercial outcome include: does the proposed format give buyers the ability to resolve their key evaluation questions independently? Is the production accurate enough to set buyer expectations that the eventual delivered product will meet? Does the proposed approach serve international buyer audiences without geographic or hardware constraints? And does it generate engagement data that improves the sales team’s follow-up efficiency? A visualization package that answers yes to all of these questions costs more than one that answers no to most of them — and is consistently worth more than the difference.
Explore More From HUUR
Virtual Art Gallery: The Powerful New Future of Art Exhibitions
How Real-Time and Immersive Technology Affects Pricing
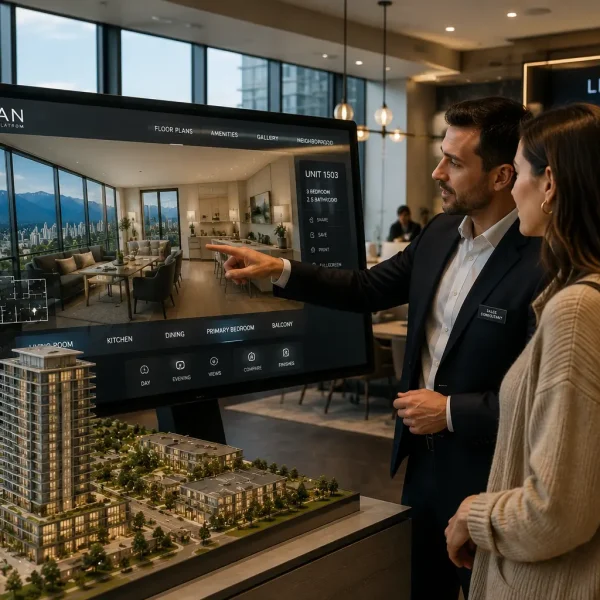
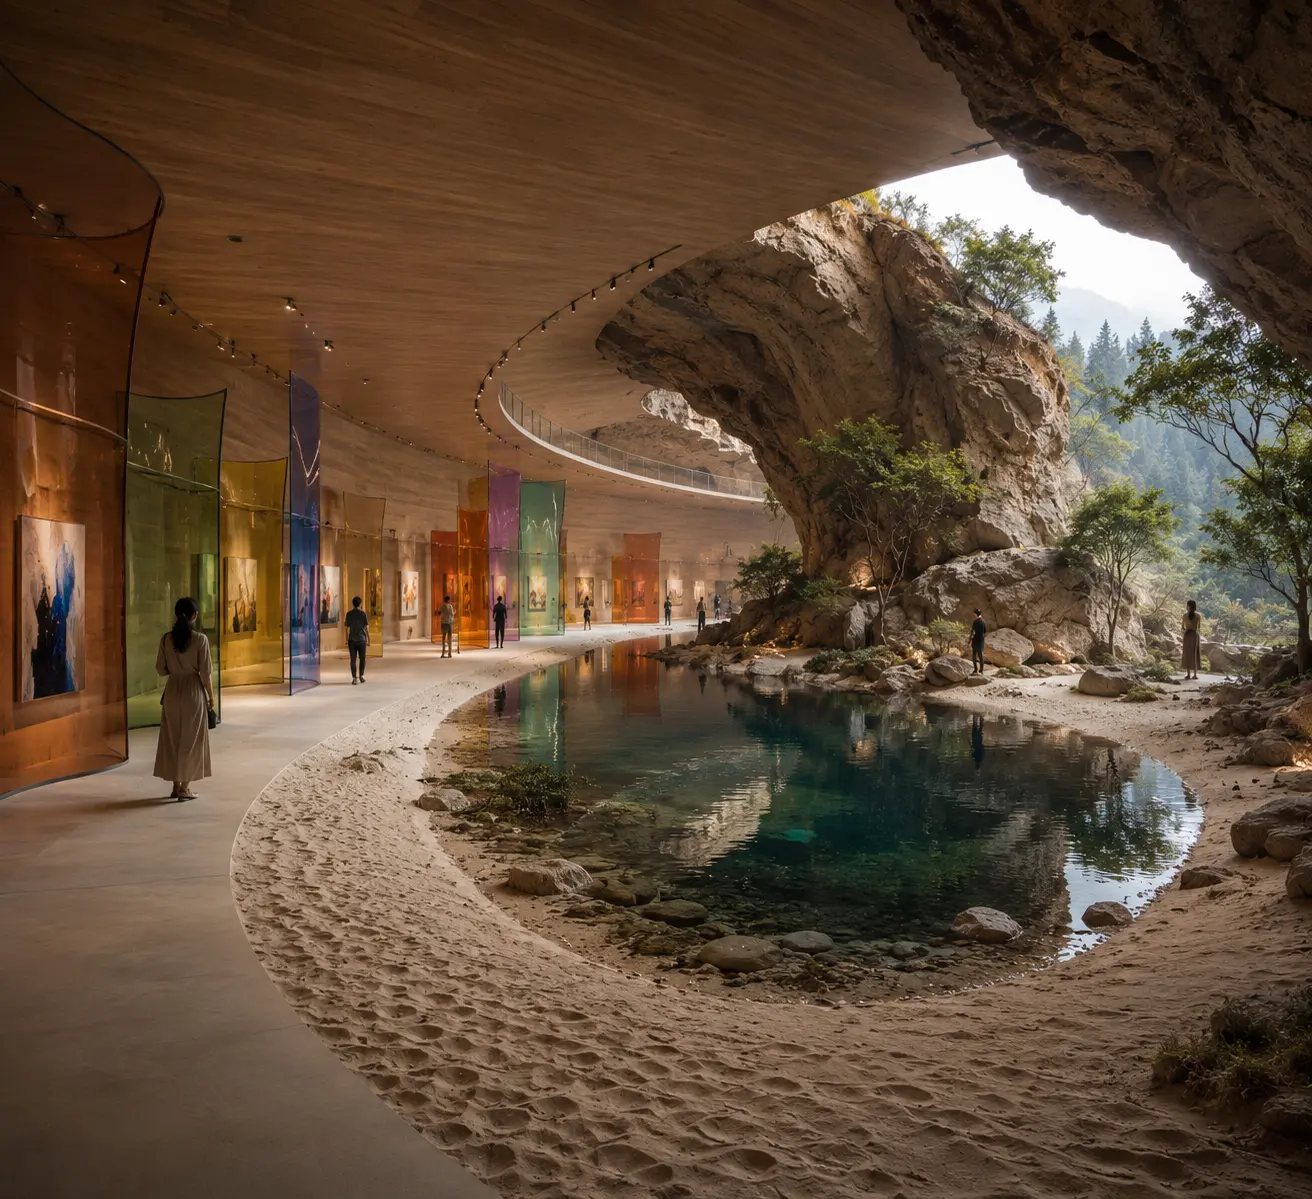
Real-time visualization pricing reflects the significant additional infrastructure, engineering, and production investment that genuinely interactive, real-time environments require relative to static renders — but it also reflects the substantially stronger commercial performance that well-built real-time environments deliver relative to equivalent static marketing campaigns. Understanding this return dynamic is essential for evaluating real-time architectural visualization pricing accurately rather than simply comparing the sticker price to a static render package that appears to cover similar visual ground at lower absolute cost.
The production investment that drives real-time visualization pricing includes platform engineering capability — the expertise to build, optimize, and deploy interactive environments on Unreal Engine or comparable real-time platforms across desktop, mobile, and VR delivery formats. This engineering capability is genuinely scarce in the professional visualization market, and its scarcity is accurately reflected in pricing models for visualization services that include real-time delivery. Studios offering real-time environments at static render price points are almost always delivering pre-rendered video walkthroughs described as interactive rather than genuinely navigable real-time experiences.
What Real-Time Pricing Includes That Static Does Not
According to research published by the National Association of Realtors, listings that offer immersive and interactive digital content consistently generate measurably stronger buyer engagement and conversion outcomes than those relying on static imagery — reinforcing the commercial case for the premium architectural visualization pricing that genuinely interactive real-time environments carry relative to static render alternatives.
A real-time architectural visualization pricing package from HUUR Studios typically includes the full interactive environment build, finish configurability development, multi-platform deployment, ongoing update capability as design evolves through the presale period, and the engagement analytics infrastructure that allows sales teams to use buyer interaction data for targeted follow-up. None of these components exist in a static render package — and the commercial value they deliver across a presale campaign of 6 to 12 months compounds through every buyer engagement with the platform.
Pricing Models for Interactive vs Static Deliverables
Pricing models for visualization services differ structurally between static and interactive deliverables — and understanding this structural difference helps clients budget accurately for each format. Static render packages are typically priced per image or per scene, with clear per-unit costs that allow straightforward budget calculation as scene count changes. Real-time interactive environments are more commonly priced as project packages — encompassing the full build investment for a defined scope — because the platform development cost does not scale linearly with the number of units or configurations the environment represents.
This pricing model difference produces an economy of scale for complex developments that static render approaches cannot match. A real-time environment representing 12 unit types and 4 finish packages may cost 40% more than an equivalent static render coverage set — but it covers every configuration within one platform rather than requiring 48 separate static assets, with far stronger buyer engagement capability on every one of those configurations. For complex Vancouver developments, the architectural visualization pricing comparison shifts significantly in favour of real-time once the full static render production requirement is properly scoped.
Evaluating Visualization Pricing Based on Outcomes, Not Just Cost
The most commercially productive framework for evaluating architectural visualization pricing is one that treats architectural visualization pricing as an investment decision is to compare proposed deliverables against the specific commercial outcomes the client needs to generate rather than against the cost of other visualization options that appear to cover similar ground. This outcome-first evaluation framework requires defining, before any quote is evaluated, what the visualization investment needs to achieve: what buyer conversion rate improvement would justify the investment, what reduction in presale campaign duration would recover the visualization cost through carrying cost savings, and what post-sale satisfaction improvement would reduce dispute and remediation exposure in proportion to the production accuracy investment.
The value of architectural visualization measured against these outcome metrics is consistently higher than the same investment measured against the per-image cost of alternative options — because the per-image metric measures only the cost of producing the asset while the outcome metric measures the commercial return generated by deploying it across a presale campaign. HUUR Studios presents visualization service pricing and architectural visualization pricing to Vancouver clients within this outcome framework — projecting the specific commercial outcomes the proposed package is designed to generate and connecting those projections to the investment being proposed.
ROI Metrics for Visualization Investment
The specific ROI metrics that frame every architectural visualization pricing conversation at HUUR Studios with Vancouver and North American developers include presale campaign duration — how many weeks of carrying cost the visualization investment needs to save to break even against the alternative of a lower-cost package; buyer conversion rate improvement — what percentage increase in inquiry-to-offer conversion would make the investment cost-neutral against the visualization budget difference; and post-sale satisfaction — what reduction in post-possession dispute costs would the accuracy improvement of premium visualization generate over the campaign and delivery period.
These metrics are calculable for most Vancouver developments with publicly available data about typical presale campaign durations, carrying cost rates, and conversion benchmarks across comparable developments. When the calculation is done honestly, the architectural visualization pricing premium between HUUR Studios and lower-cost alternatives is typically recovered within 2 to 4 weeks of presale campaign acceleration — making the visualization investment cost-positive from that point forward for every week the campaign runs at superior conversion rates.
Getting the Most From Your Visualization Budget
The clients who extract the strongest commercial return from their visualization investment — regardless of absolute budget level — share a common approach: they define commercial objectives before briefing any studio, they evaluate proposed packages against those objectives rather than against competing quotes, and they treat visualization as a revenue-generating investment with measurable returns rather than a marketing cost with a negotiable price. This orientation produces better briefing conversations, more accurate scope definitions, and stronger commercial outcomes from every visualization budget level than the alternative of treating visualization as a commodity to be sourced at minimum cost.
HUUR Studios welcomes the outcome-first visualization conversation with every Vancouver and North American client — because our pricing is designed to reflect the commercial value our work generates rather than simply the production hours it consumes. Clients who understand this framework consistently achieve stronger presale outcomes and stronger long-term relationships with a visualization partner whose financial interests are aligned with theirs.
FAQ — Architectural Visualization Pricing
How much does architectural visualization cost?
Architectural visualization pricing varies from a few thousand dollars for basic static renders to six figures for comprehensive real-time interactive environments with finish configurability and multi-platform deployment. The right investment depends on project scale, format requirements, and the commercial outcomes the visualization needs to generate.
Why do architectural visualization prices vary so much?
Architectural visualization pricing varies because fundamentally different products — documentation renders, campaign-quality hero images, and real-time interactive environments — are all described using the same terminology. Production depth, technical infrastructure, and commercial purpose drive the differences more than studio size or reputation alone.
Is real-time visualization more expensive than static rendering?
Real-time visualization pricing is typically higher than equivalent static rendering because it requires platform engineering, interactive feature development, and multi-platform deployment capability that static production does not. For complex developments, real-time can represent better value per configuration once the full static alternative scope is properly costed.
How should clients evaluate the value of visualization services?
Compare proposed packages against the commercial outcomes they need to generate — presale campaign duration, buyer conversion rates, and post-sale satisfaction — rather than against competing quotes at lower prices. Visualization service pricing that appears expensive per image frequently proves cost-positive through campaign performance measured over months.
The lowest visualization quote is rarely the lowest project cost.
The real value of architectural visualization is not measured by the number of images delivered or the price per render — it is measured by how effectively it helps buyers understand a project, accelerates decisions, reduces uncertainty, and supports stronger commercial outcomes.
At HUUR Studios, we help developers and architectural teams understand exactly what they are investing in — from production methodology and real-time capabilities to interactive experiences designed around measurable project goals.
Whether you are planning a presale campaign, comparing visualization options, or looking for the right digital strategy for your next development, we can help you identify the approach that creates the strongest return.
Discuss your project with our team and discover what the right visualization strategy can achieve.
Conclusion
Architectural visualization pricing is best understood as an investment decision with measurable commercial returns rather than a cost to be minimized against a fixed deliverable specification. The developers and architectural practices across Vancouver and North America who approach visualization investment with this framework consistently achieve stronger presale outcomes, shorter campaign durations, and higher buyer satisfaction scores than those who evaluate visualization quotes primarily on price per image or deliverable count. The hidden costs of inadequate visualization are real, measurable, and consistently larger than the visible cost of the investment that would have prevented them.
HUUR Studios approaches every architectural visualization pricing conversation with complete transparency about what drives cost, what distinguishes our production quality and technical capability from alternatives at lower price points, and what commercial outcomes our work is designed to generate for Vancouver and North American development clients. We believe that a client who understands the full value framework makes a better investment decision — and that better decisions consistently produce stronger results for the developments we work on together.
If you are evaluating visualization options for your next development and want a frank conversation about architectural visualization pricing, commercial return, and what genuine production quality delivers relative to lower-cost alternatives, HUUR Studios is exactly the right partner for that conversation.